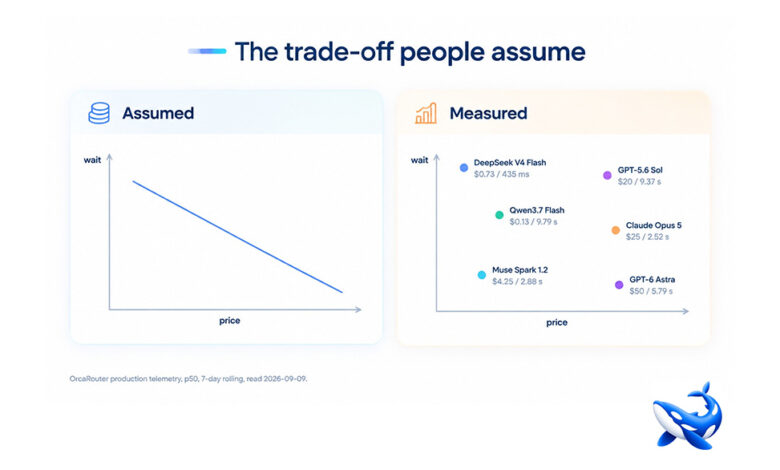

The question that stops most cost-reduction projects is whether the cheap tier will feel slow. It is a reasonable worry and, on this data, an unfounded one — the fastest first token in that data comes from a model at seventy-three cents per million output. OrcaRouter measures latency on live traffic, so the assumption is checkable rather than folklore — and deciding ai api pricing on an assumed speed penalty costs money for nothing.
Prices and latency read 2026-09-09.
The measured relationship
| Model | Output /1M | p50 first token |
| DeepSeek V4 Flash | $0.73 | 435 ms |
| DeepSeek V4 Flash 0731 | $0.73 | 748 ms |
| DeepSeek V4 Pro | $2.18 | 831 ms |
| DeepSeek V4 Pro 0813 | $2.18 | 886 ms |
| Claude Opus 5 | $25.00 | 2.52 s |
| Qwen3.8 Max (0902) | $6.00 | 2.82 s |
| Muse Spark 1.2 | $4.25 | 2.88 s |
| Gemini 3.5 Flash | $9.00 | 4.06 s |
| Qwen3.8 Max | $6.00 | 4.09 s |
| Claude Fable 5.1 | $50.00 | 4.14 s |
| Claude Opus 4.8 | $25.00 | 4.38 s |
| GPT-5.5 Pro | $180.00 | 5.00 s |
| GPT-6 Astra | $50.00 | 5.79 s |
| Claude Fable 5 | $50.00 | 6.70 s |
| GLM 5.3 Flash | $0.25 | 6.97 s |
| GPT-5.6 Sol | $20.00 | 9.37 s |
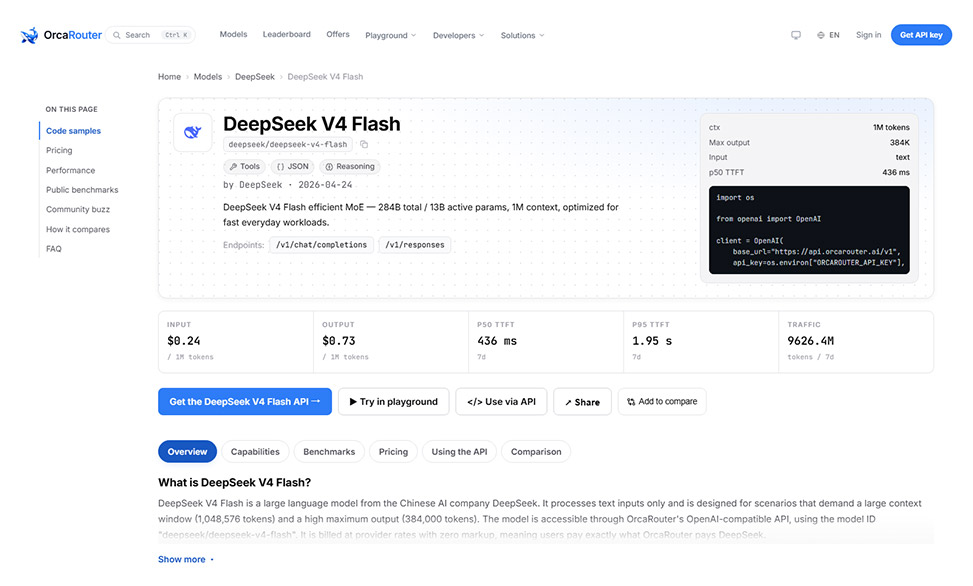
| Qwen3.7 Flash | $0.13 | 9.79 s |
Ordered by speed, the price column is scrambled. The four fastest entries cost $0.73 to $2.18. The most expensive model on the list, at $180.00, is slower than one costing a seventh as much.
But the cheap tier is not uniformly fast either
Being honest about the data cuts both ways. Within the utility tier the spread is enormous:
- DeepSeek V4 Flash — $0.73 — 435 ms
- GLM 5.3 Flash — $0.25 — 6.97 s
- Qwen3.7 Flash — $0.13 — 9.79 s
A 16x latency spread inside a tier whose prices differ by 5.6x. So “go cheap and you will be fine” is as wrong as “go cheap and you will wait” — the correct statement is that latency is a property of the specific model and its serving stack, and price carries almost no information about it.
What does carry information is the provider family. DeepSeek’s four entries hold the four fastest positions. The GPT-5 generation occupies the slow end. That is a more useful prior than anything in the price column.
What to do with this
If you are considering a cost reduction, check the candidate’s latency instead of assuming it. The assumption is what talks teams out of a 30x saving. On this data the saving and the speed are frequently available together.
Do not treat a tier as a latency guarantee in either direction. Shortlist by price, then rank the shortlist by measured latency, then test quality. Three separate steps, and the middle one is the one people skip.
Ignore all of it if you are batching. First-token latency is a user-experience metric. A queue cares about throughput and cost per piece, and on those axes the cheap tier wins without qualification.
Three limits on these numbers
Two figures are not measurements. Grok 4.6 and Gemini 3.6 Flash both report 10.00 s, which is a reporting ceiling rather than an observed value. They are excluded from the table above; read them as “not measured” rather than “slow”.
These are 7-day rolling windows and they drift daily. Claude Opus 5’s median moved 3.09 s → 2.82 s → 2.52 s across three consecutive reads. The ordering has held across those reads; the decimals have not.
They are one platform’s traffic. Latency is a property of a route under load — prompt lengths, concurrency, region, time of day. A median measured on someone else’s mix, this one included, tells you which candidate to test first and nothing about what you will see. And median describes the request nobody complains about: support tickets come from the tail, which you have to measure yourself.
What actually predicts latency
If price does not, something should. Four things do, in rough order of effect, and all are checkable before you commit.
Model size and architecture. Smaller models genuinely start faster. This is the mechanism behind the sub-second figures — they belong to models positioned as fast, small-footprint options, and that positioning is usually honest.
Provider serving stack. The clearest pattern in this data is by family, not by price: one provider’s four entries occupy the four fastest positions while another’s generation clusters at the slow end. Quantisation, batching policy and provisioned headroom differ per provider and they dominate.
Region and distance. Latency includes network time, and a model served from a distant region carries that overhead on every request regardless of price or size.
Current load. Time to first token includes queueing. A model under heavy demand is slower at 10am than at 3am, and none of that appears in a published median.
The practical order of operations: shortlist on price and capability, then measure first-token latency yourself from the region you will actually serve from, at the concurrency you will actually run. And measure p95 rather than p50 — the median describes the request nobody complains about, and complaints come from the tail.
One more practical consequence. Because latency is a route property rather than a model property, the same model can be fast for you and slow for someone else, which means published comparisons — including this one — are a shortlist tool rather than an answer. The only figure that predicts your users’ experience is the one measured from your own infrastructure, at your own concurrency, in the region you actually serve from.
And one broader point about assumptions in this space generally. The price-speed trade-off is folklore that sounds like engineering: it has the shape of a real constraint, so nobody checks it. Several of the beliefs that shape LLM architecture decisions are in that category — plausible, widely repeated, and contradicted by a table anyone could have pulled in an afternoon. The habit worth building is not scepticism about this particular claim but the reflex of checking the ones that feel too obvious to verify.
The takeaway
Across seventeen models spanning a 1,385x price range, output price and first-token latency are effectively uncorrelated. The fastest figure in the data — 435 ms — belongs to a model at $0.73 per million output, while the $180.00 model is slower than one at $25.00. But the cheap tier is not uniformly fast either: it contains both the 435 ms result and a 9.79 s one. The honest rule is that price tells you nothing about speed in either direction, so shortlist on price, rank on measured latency, and stop letting an assumed trade-off block a saving that usually is not trading anything.
Sourcing note: Output rates are the list prices OrcaRouter passes through, read 2026-09-09. Median time-to-first-token figures are OrcaRouter production telemetry read the same day, not a controlled benchmark; they reflect its traffic mix, regions and live provider load, and each is a 7-day rolling window that moves daily. Grok 4.6 and Gemini 3.6 Flash report a 10.00 s ceiling rather than a measured value and are excluded from the latency table. Median figures say nothing about tail latency, which has to be measured on your own traffic. Note on the DeepSeek rows: on 2026-09-10 DeepSeek published DeepSeek-V4.1-Flash under the identifier `deepseek-flash`, turned `deepseek-v4-flash` and `deepseek-v4-flash-vision-exp` into legacy aliases routed to it, and stated that requests to `deepseek-v4-pro` will all be routed to V4.1 Flash from 2026-09-14. The DeepSeek figures here are therefore a 2026-09-09 snapshot of a line the vendor is in the middle of consolidating.